Northgate Real Estate and Area Information
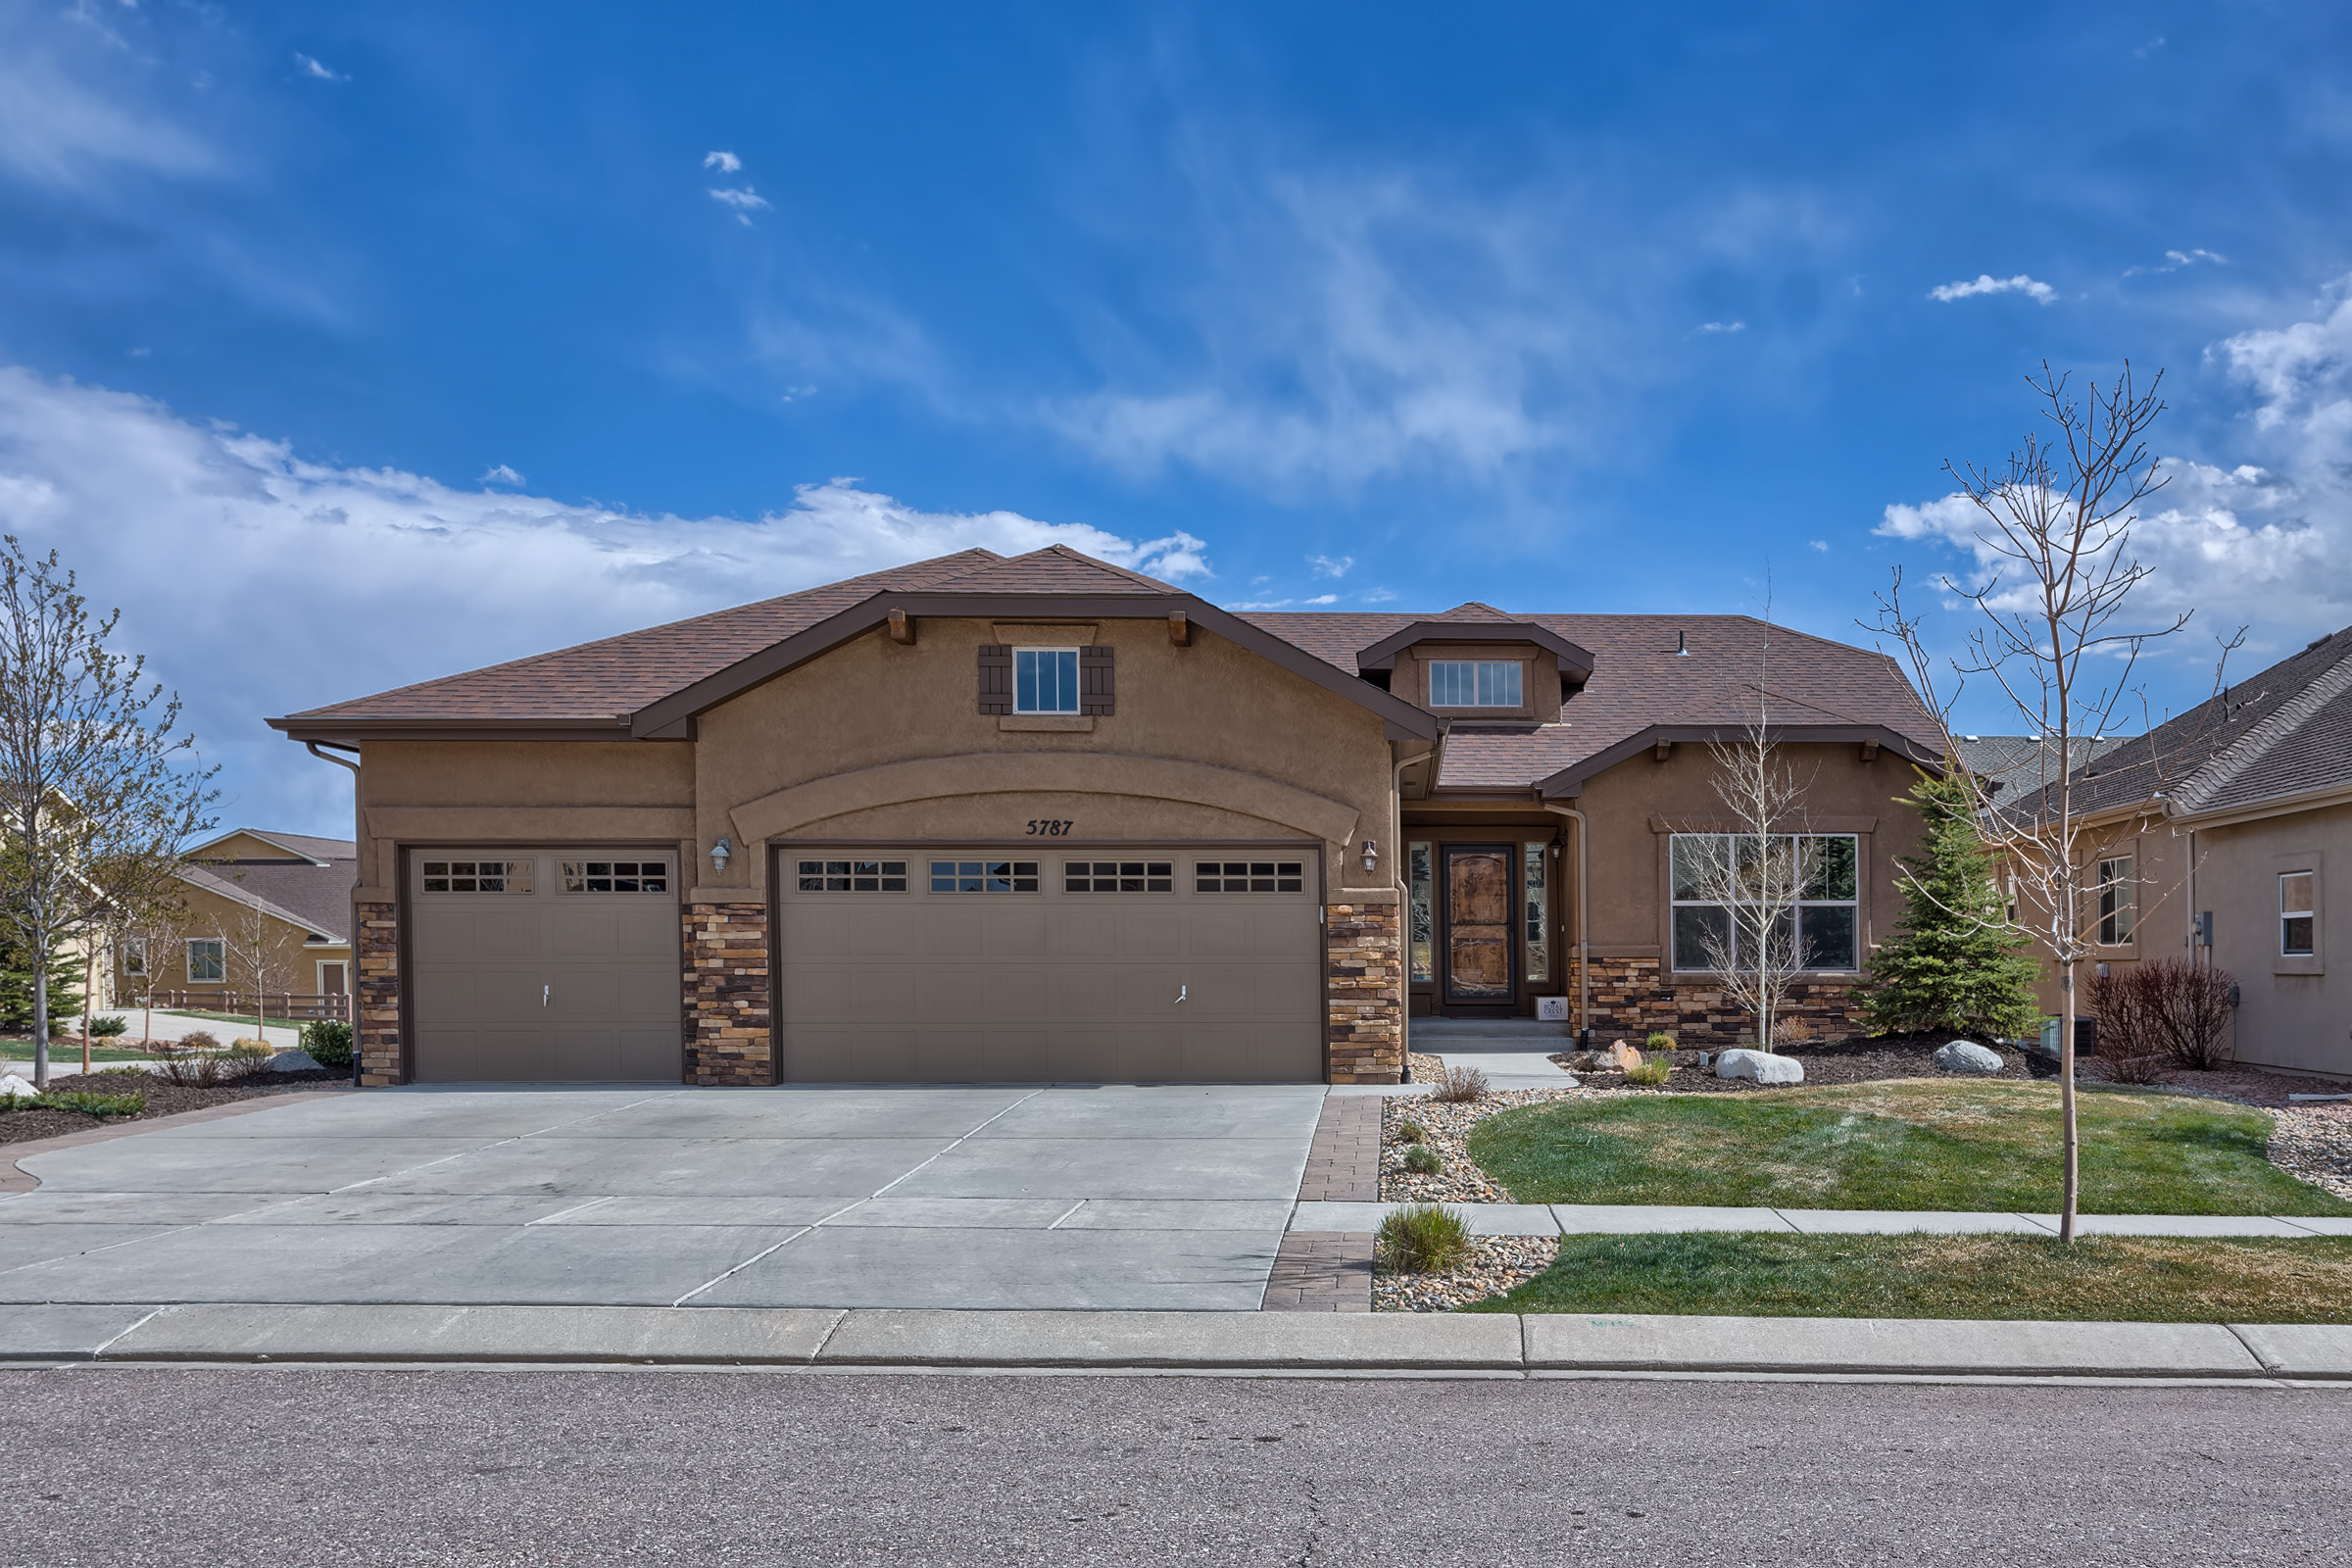
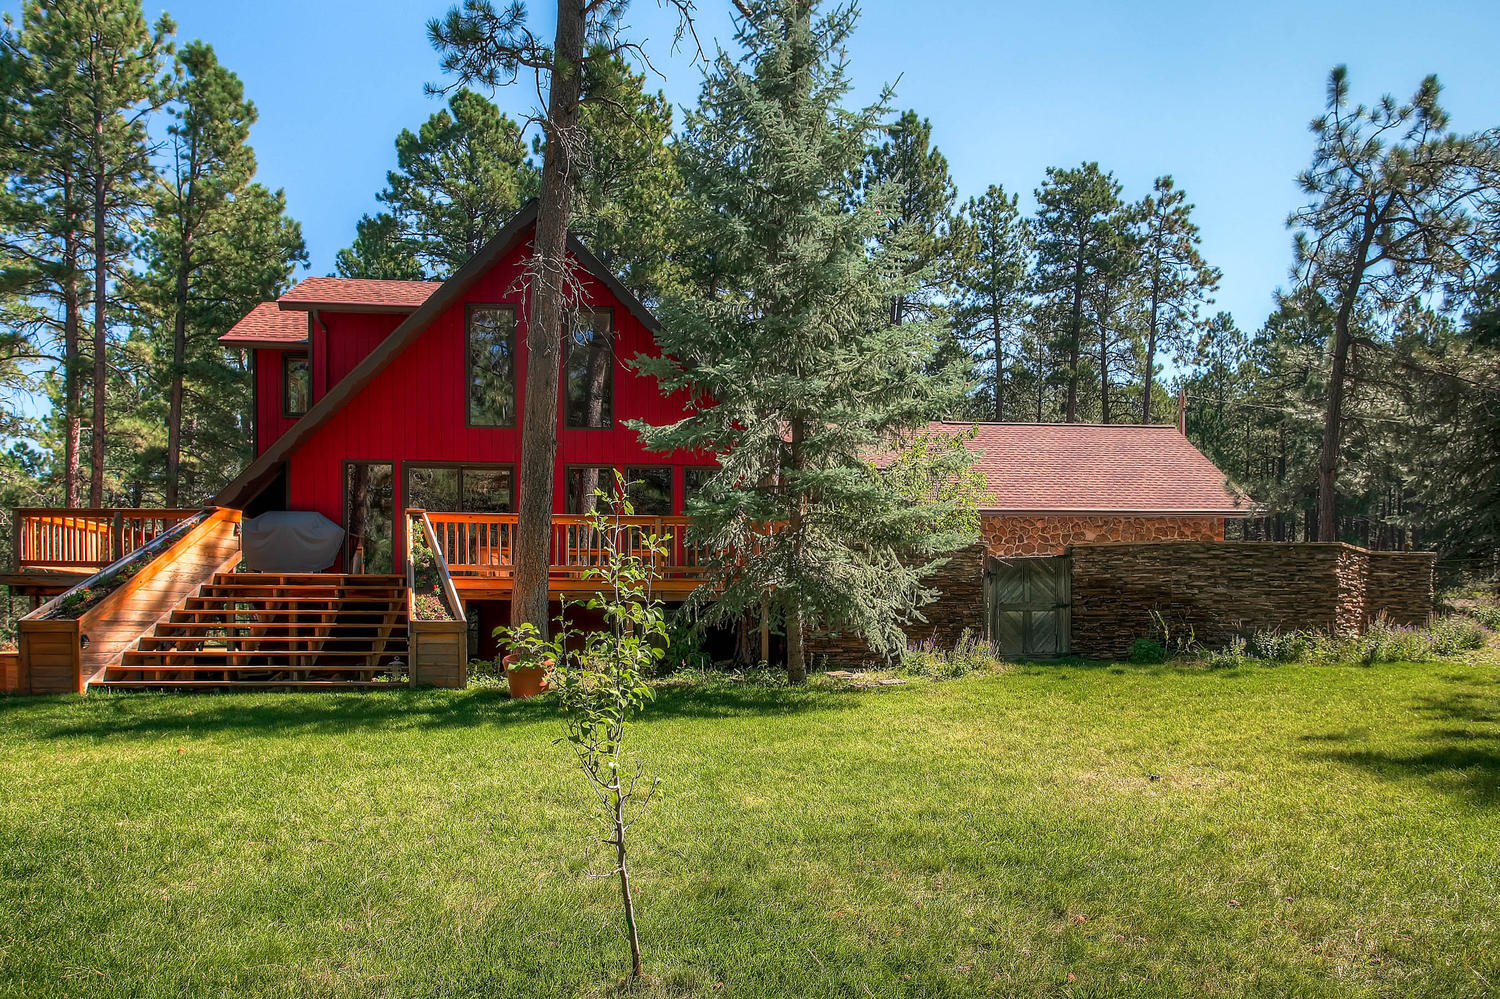
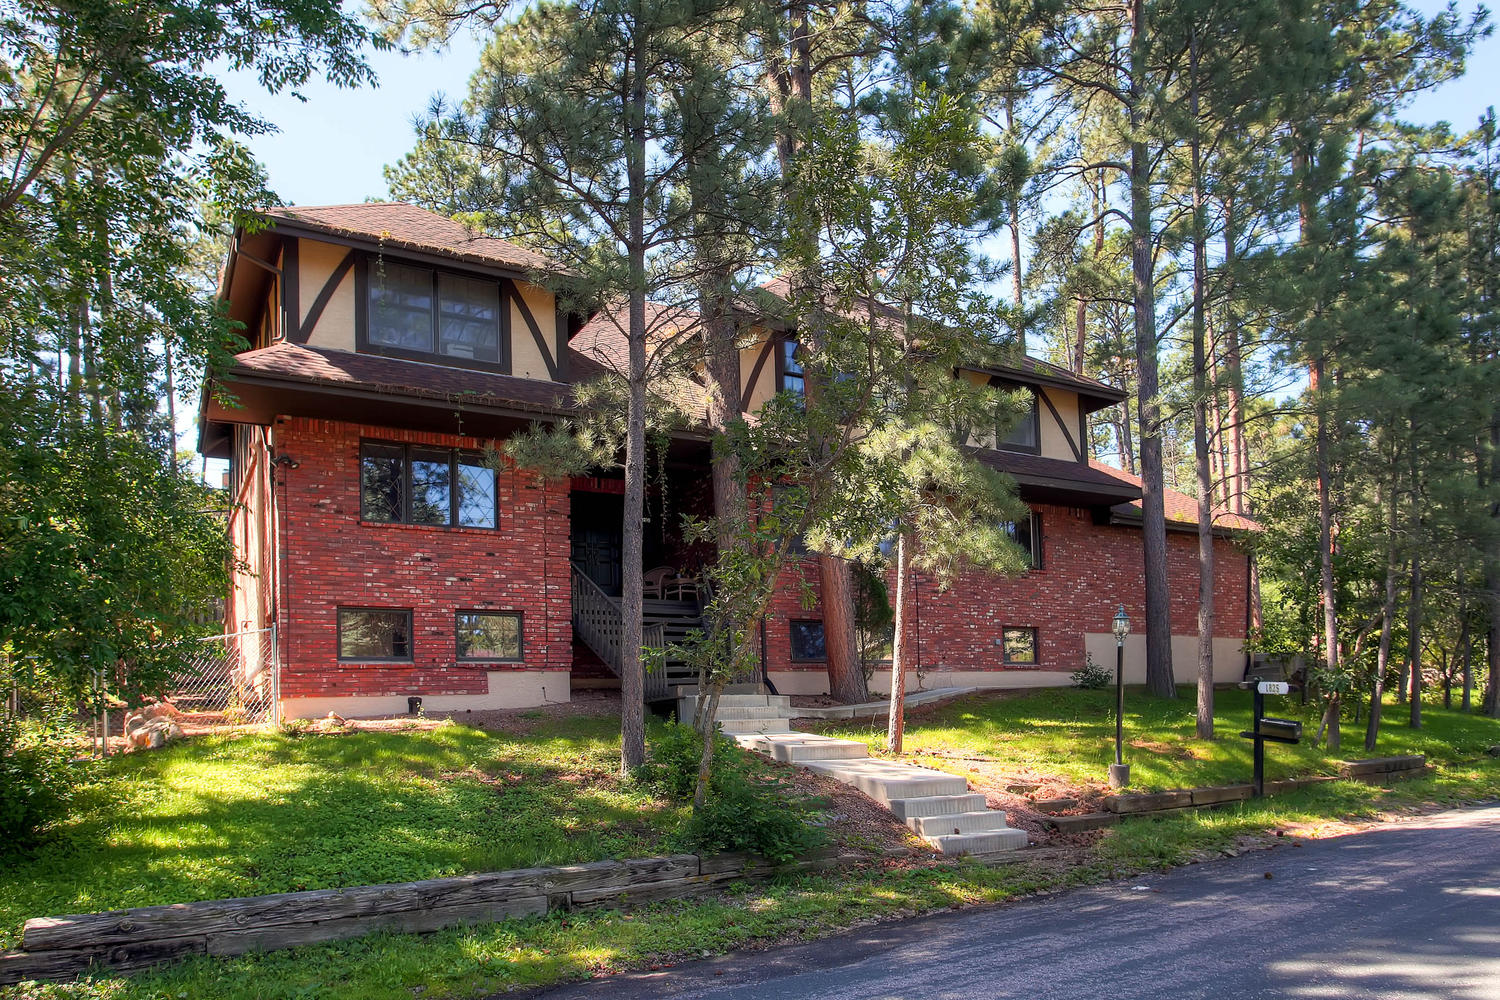
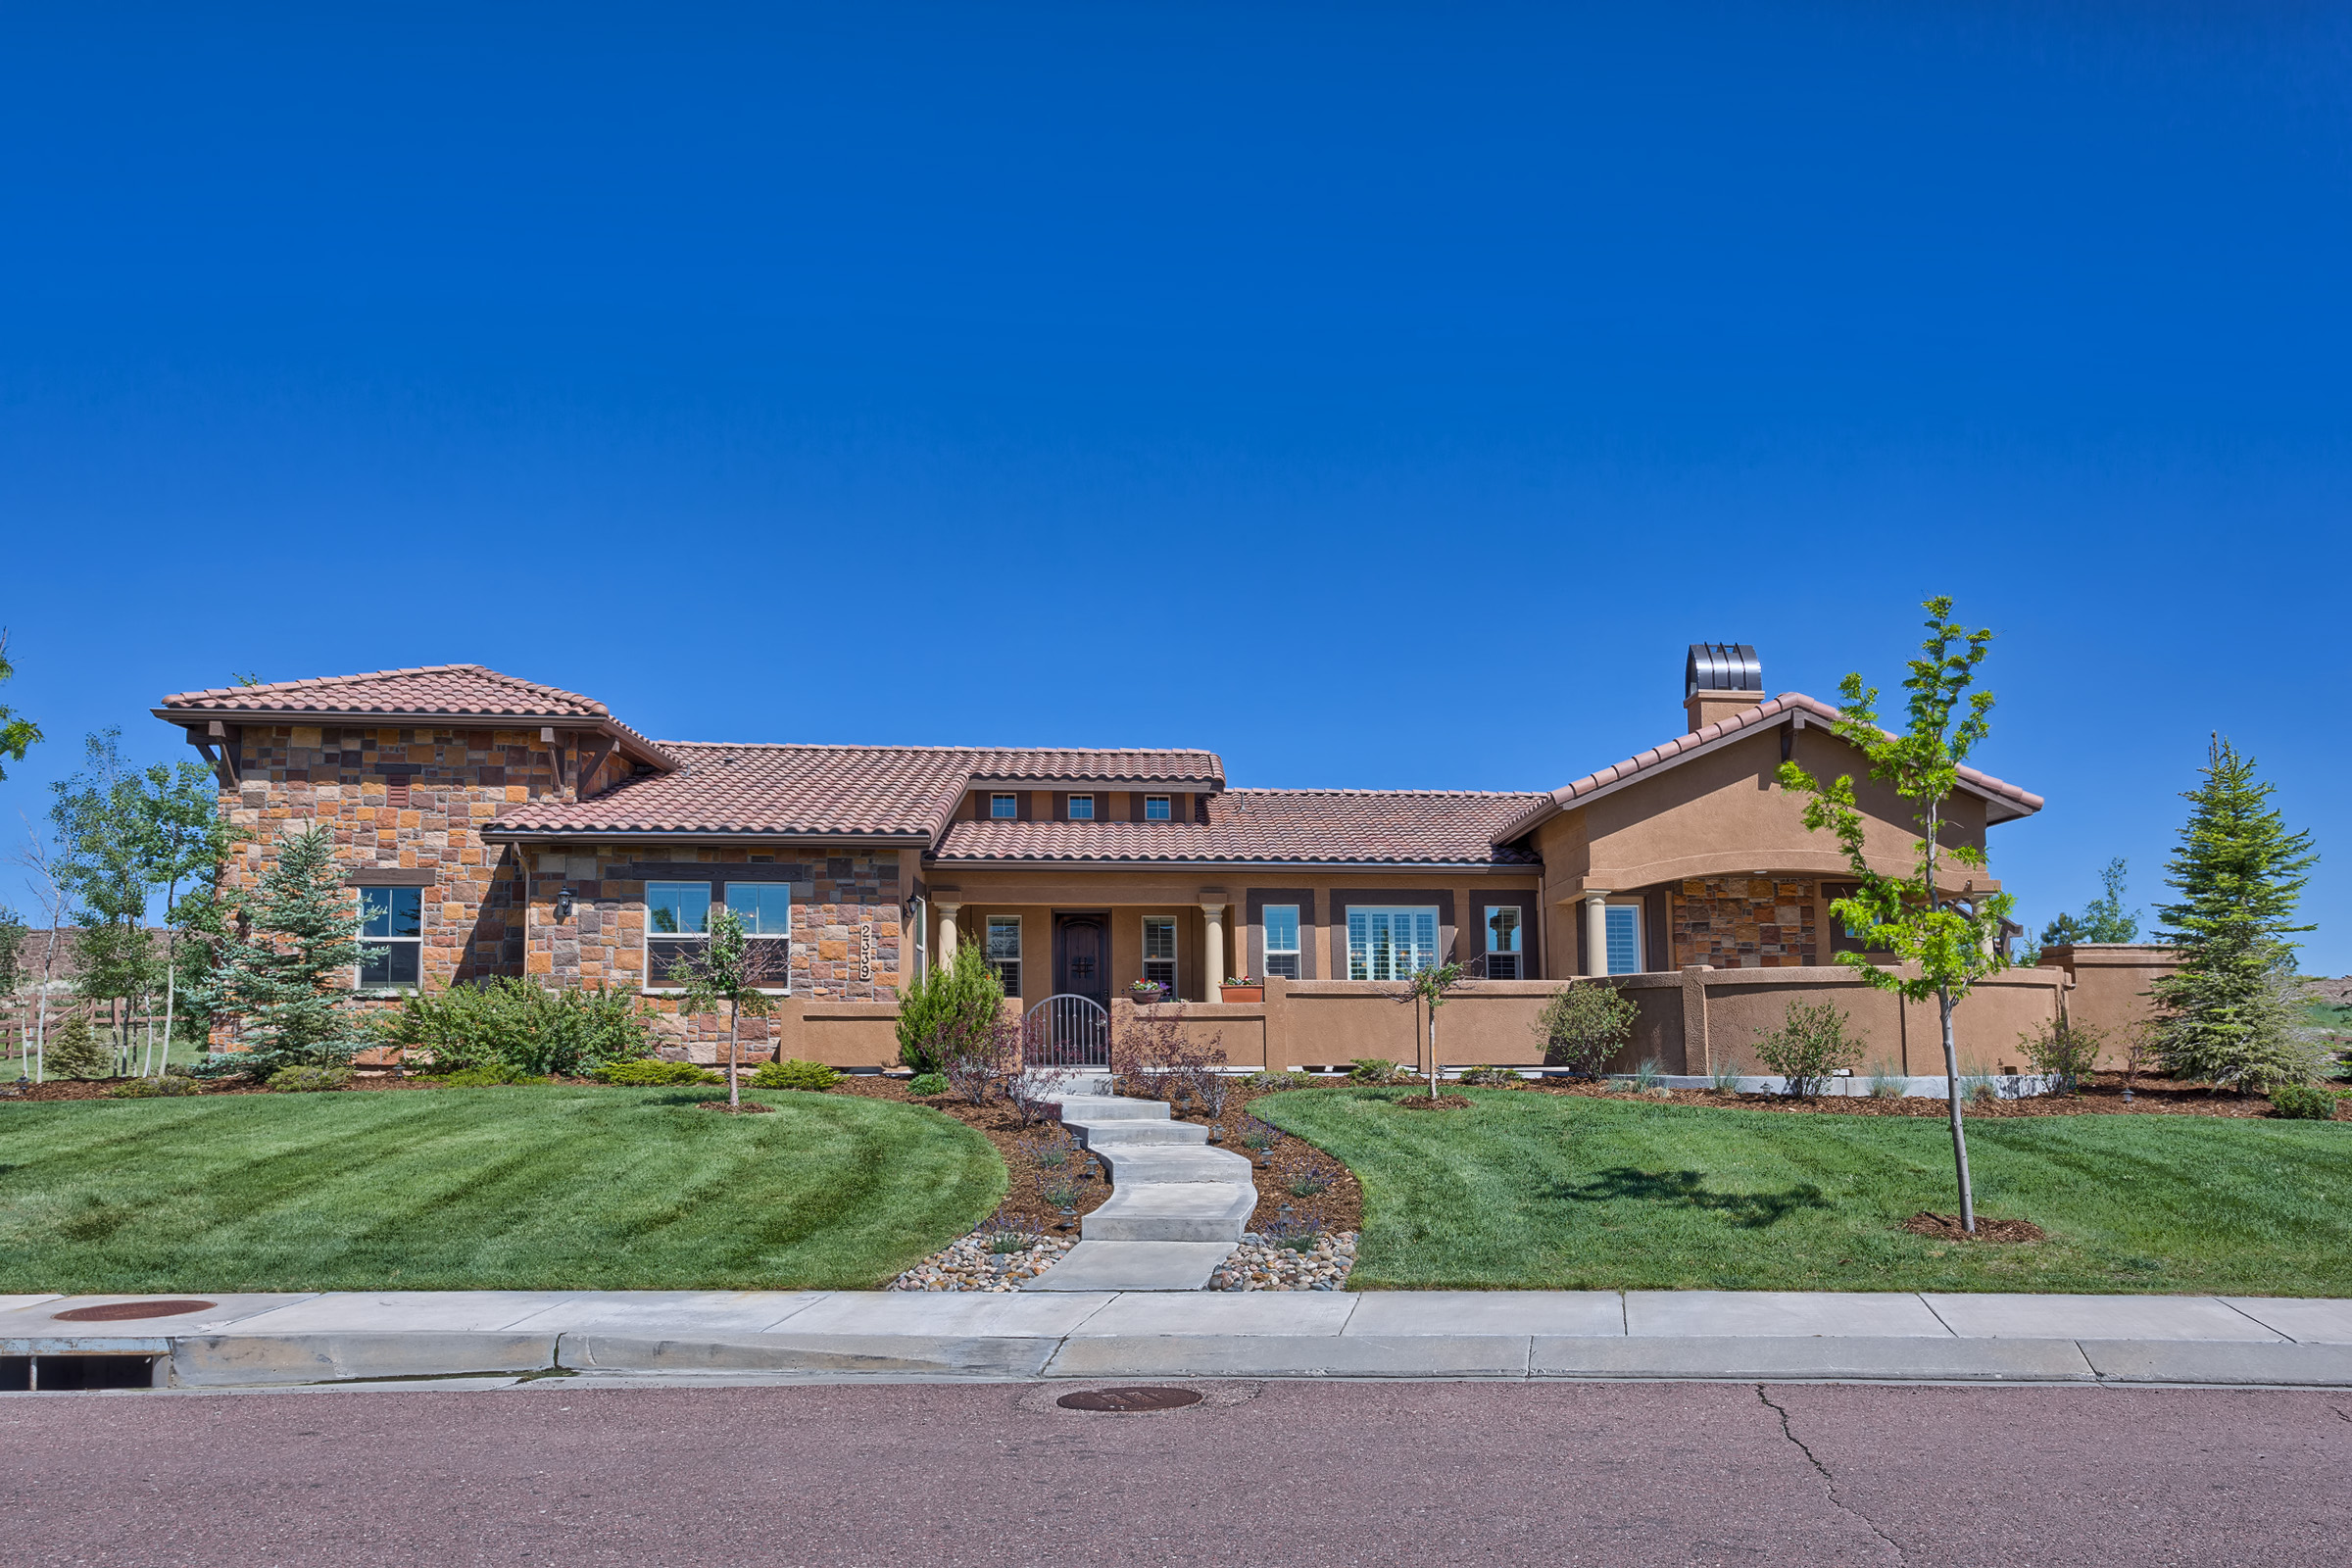
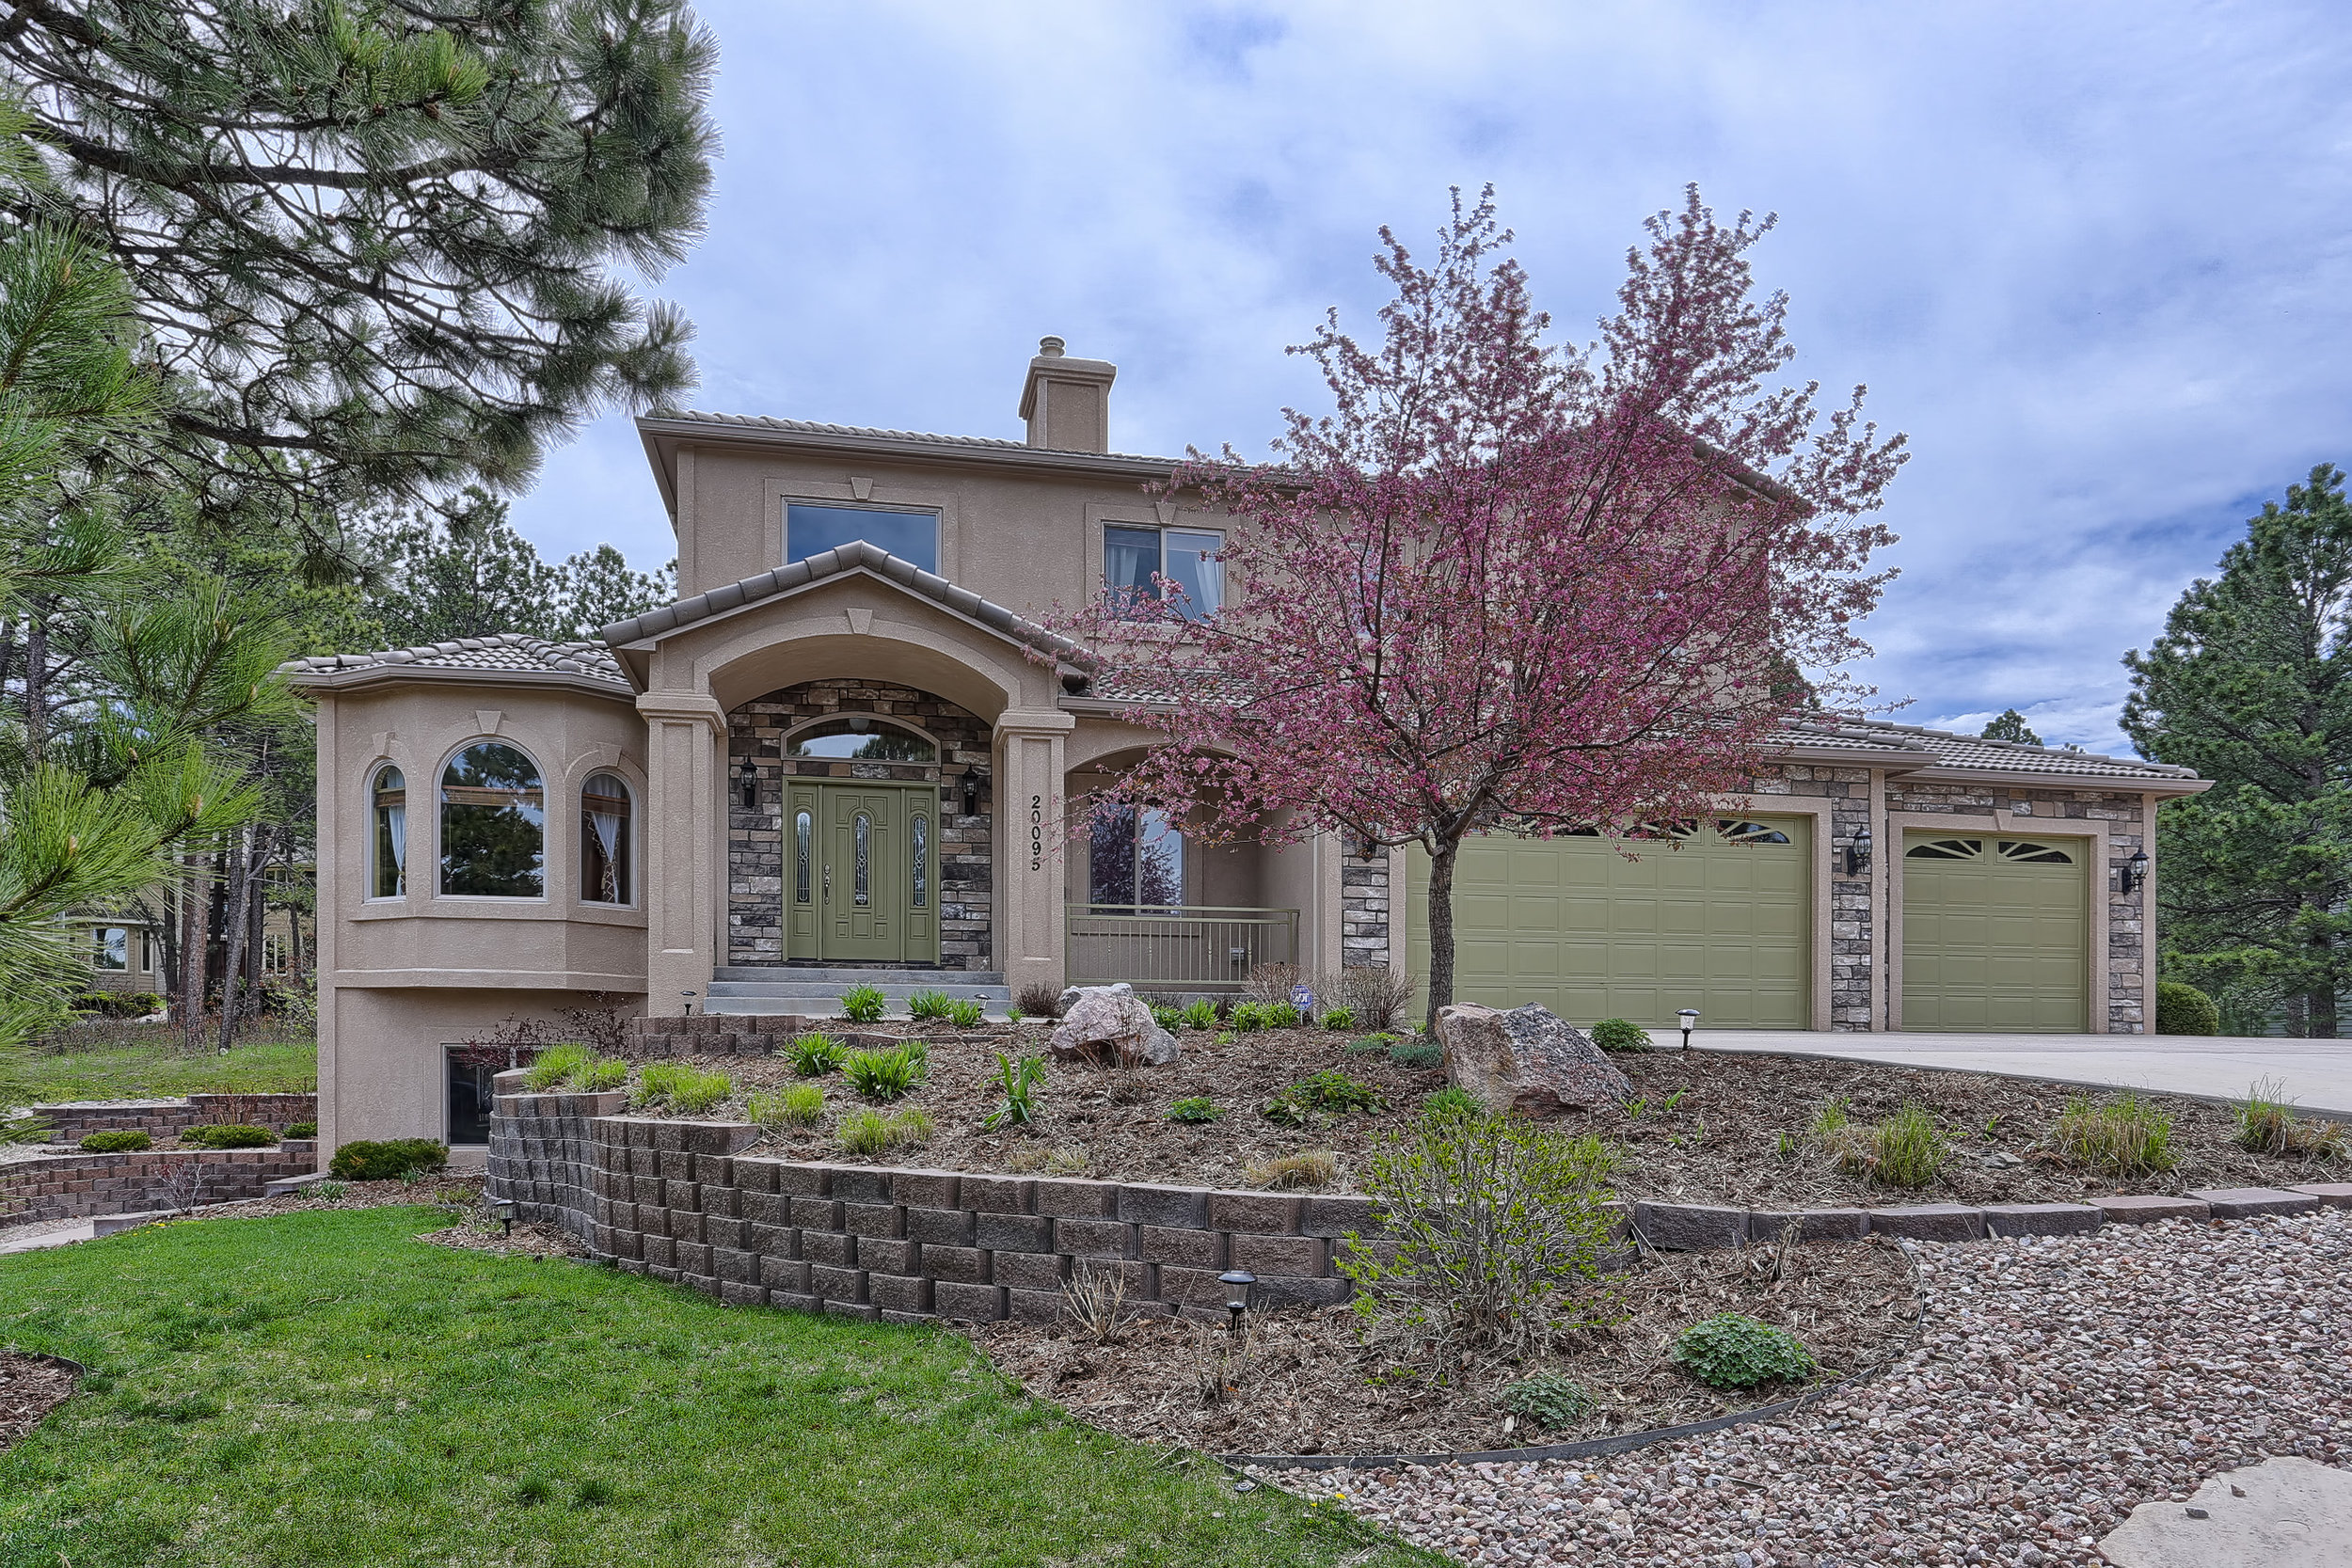
Northgate is located in the northern part of Colorado Springs. It is just east of the Air Force Academy, slightly north of Briargate, and south of Monument. The northgate area offers great views of the Pikes Peak, the Front range mountains, and the Air Force Academy. Northgate is a growing community with a lot to offer with its’ location being close to the Air Force Academy, I-25, shopping, dinning, and public parks. Flying Horse is a new community currently growing in the Northeastern part of Northgate. It offers it's residents golf course style living with a community feel. Flying Horse provides beautiful views of the mountians, a golf course, and a state of the art fitness center that is currently under development.
If you are interested in a new construction home, resale homes, or luxury custom built homes in the Northgate area, please feel free to email me and I would be more than happy to assist you in any way possible.
Northgate Area Home Search and Market Information
Zip Codes- 80921
Ave Home Price – Approx. $470,000
Home Price Range – Approx. $350,000-$1+ Million
School Districts- Academy District #20
Major Neighborhoods- The Farm, Northgate, Flying Horse, Wildwood at Northgate, Stone Crossing, Middle Creek Manor
For More detailed North Gate information you may find some useful information with our neighborhood community information tool. This is a great resource offering community characteristics, maps, aerial & "birds eye" views, nearby schools and school information and nearby attractions and amenities
Northgate Real Estate Market Trends
All real estate is local, and conditions for the Colorado Springs real estate market can change dramatically between individual areas, neighborhoods, and price points. Understanding the market dynamics involved in the broader real estate market, the individuals areas, the specific Colorado Springs neighborhood and specific home price point becomes critical when you end up putting an offer in on your next Colorado Springs home.
Total Sales
The chart to the right shows the total number of home sales for the entire Northgate area year over year. This helps give a very basic feel for home sale activity trends in the broader Northgate area.
Average Sales Price
The chart to the right shows the year over year average sales price for homes in the broader Northgate area. This shows the basic trend of home values for the entire Northgate area.
Average Days on Market before Selling
The chart to the right shows the average days a home was on the market before it went under contract. When for sale home inventory levels are high we are in a buyers market and the average days on market will be higher with downward pressure on prices. With lower inventory levels the ave days on market will be lower, a sellers market, with upward pressure on home prices.




Historically, the choice between renting or buying a home has been a tough decision.
Looking at the percentage of income needed to rent a median-priced home today (28.8%) vs. the percentage needed to buy a median-priced home (17.1%), the choice becomes obvious.
Every market is different. Before you renew your lease again, find out if you can put your housing costs to work by buying this year!