Central Colorado Springs Real Estate and Area Information
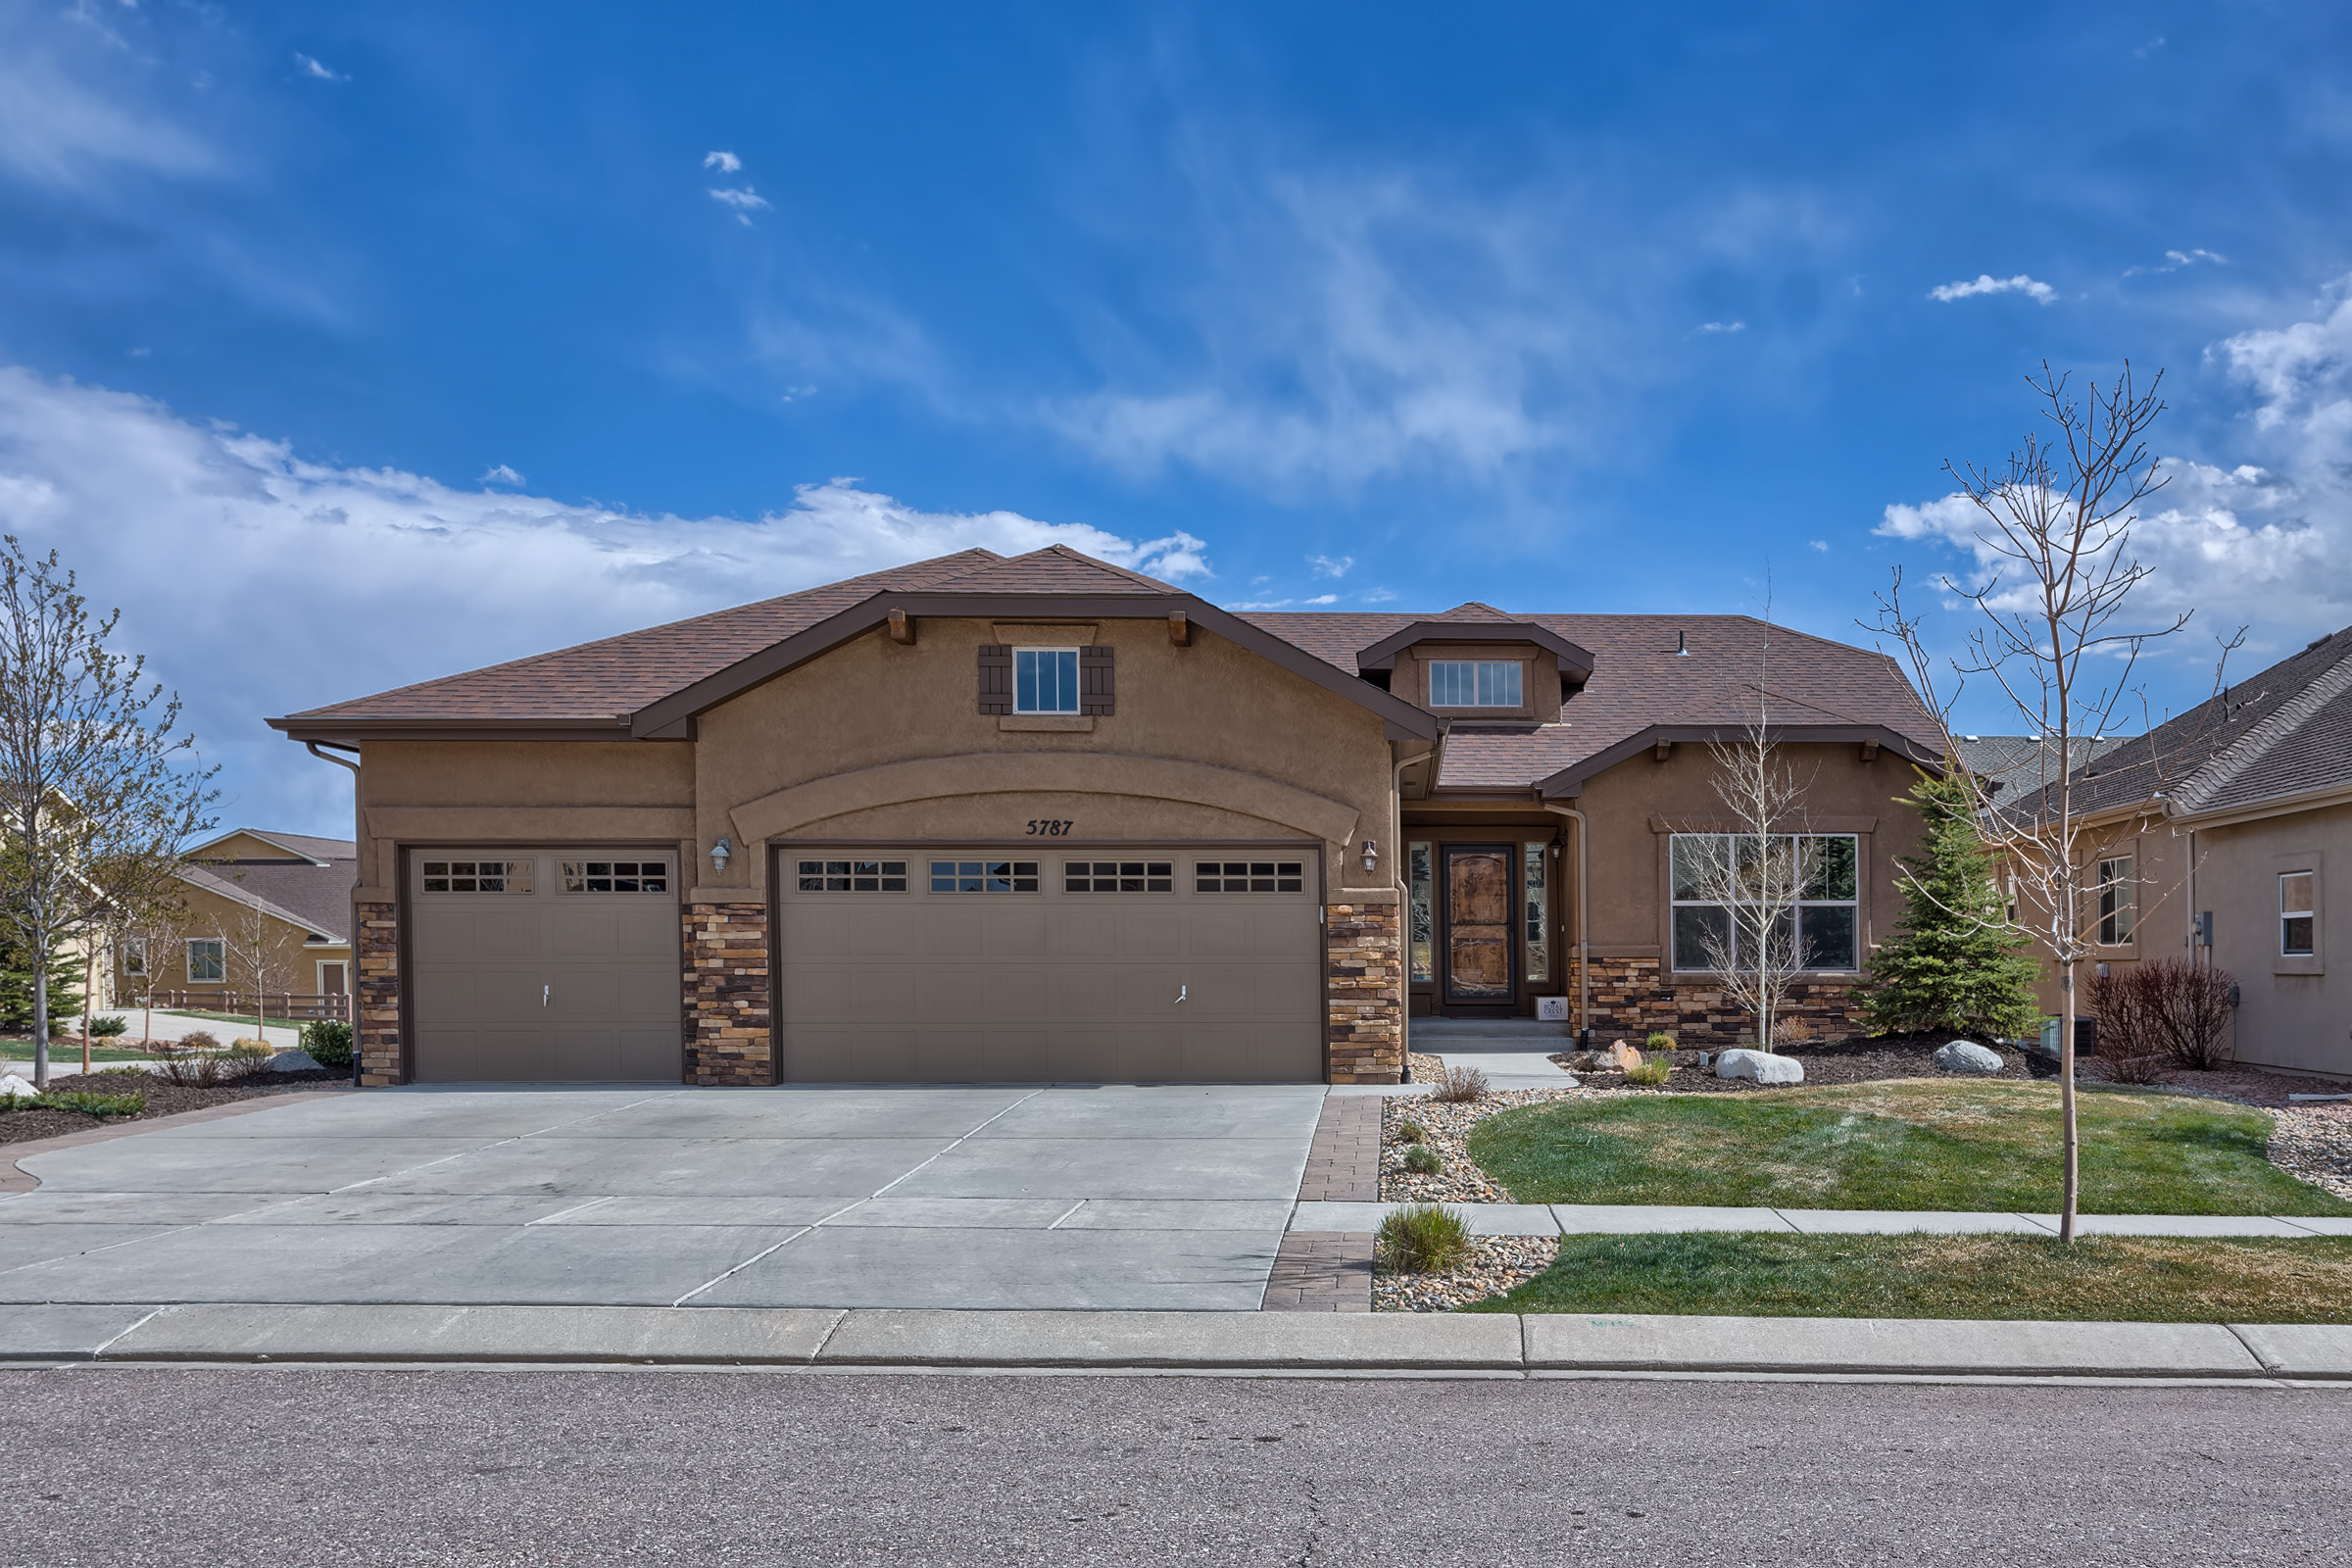
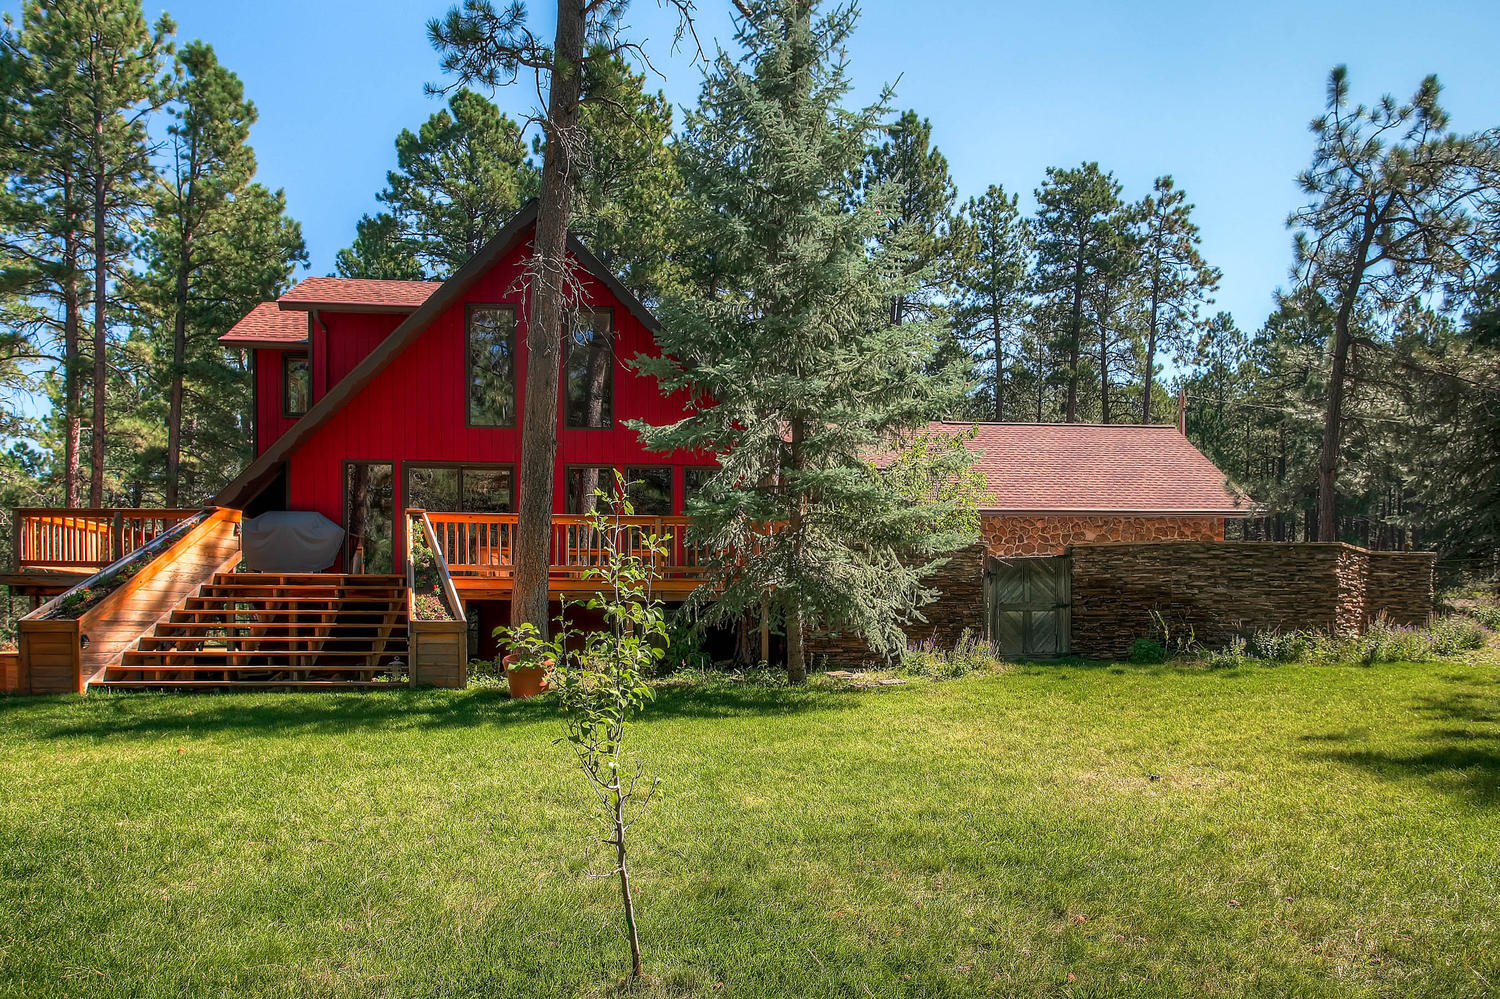
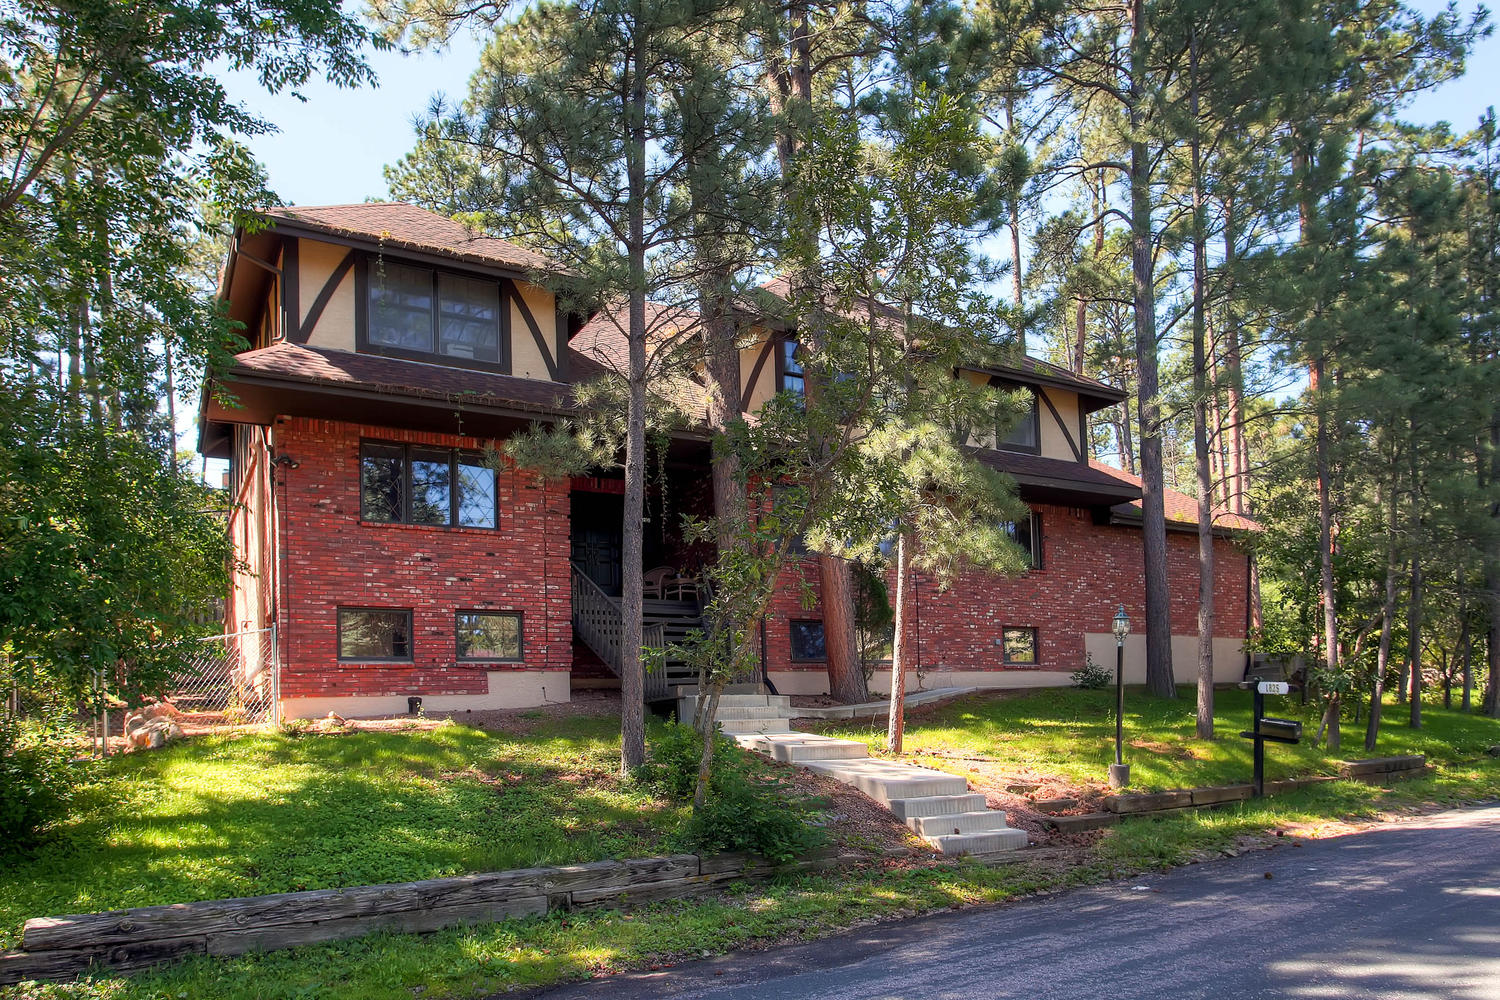
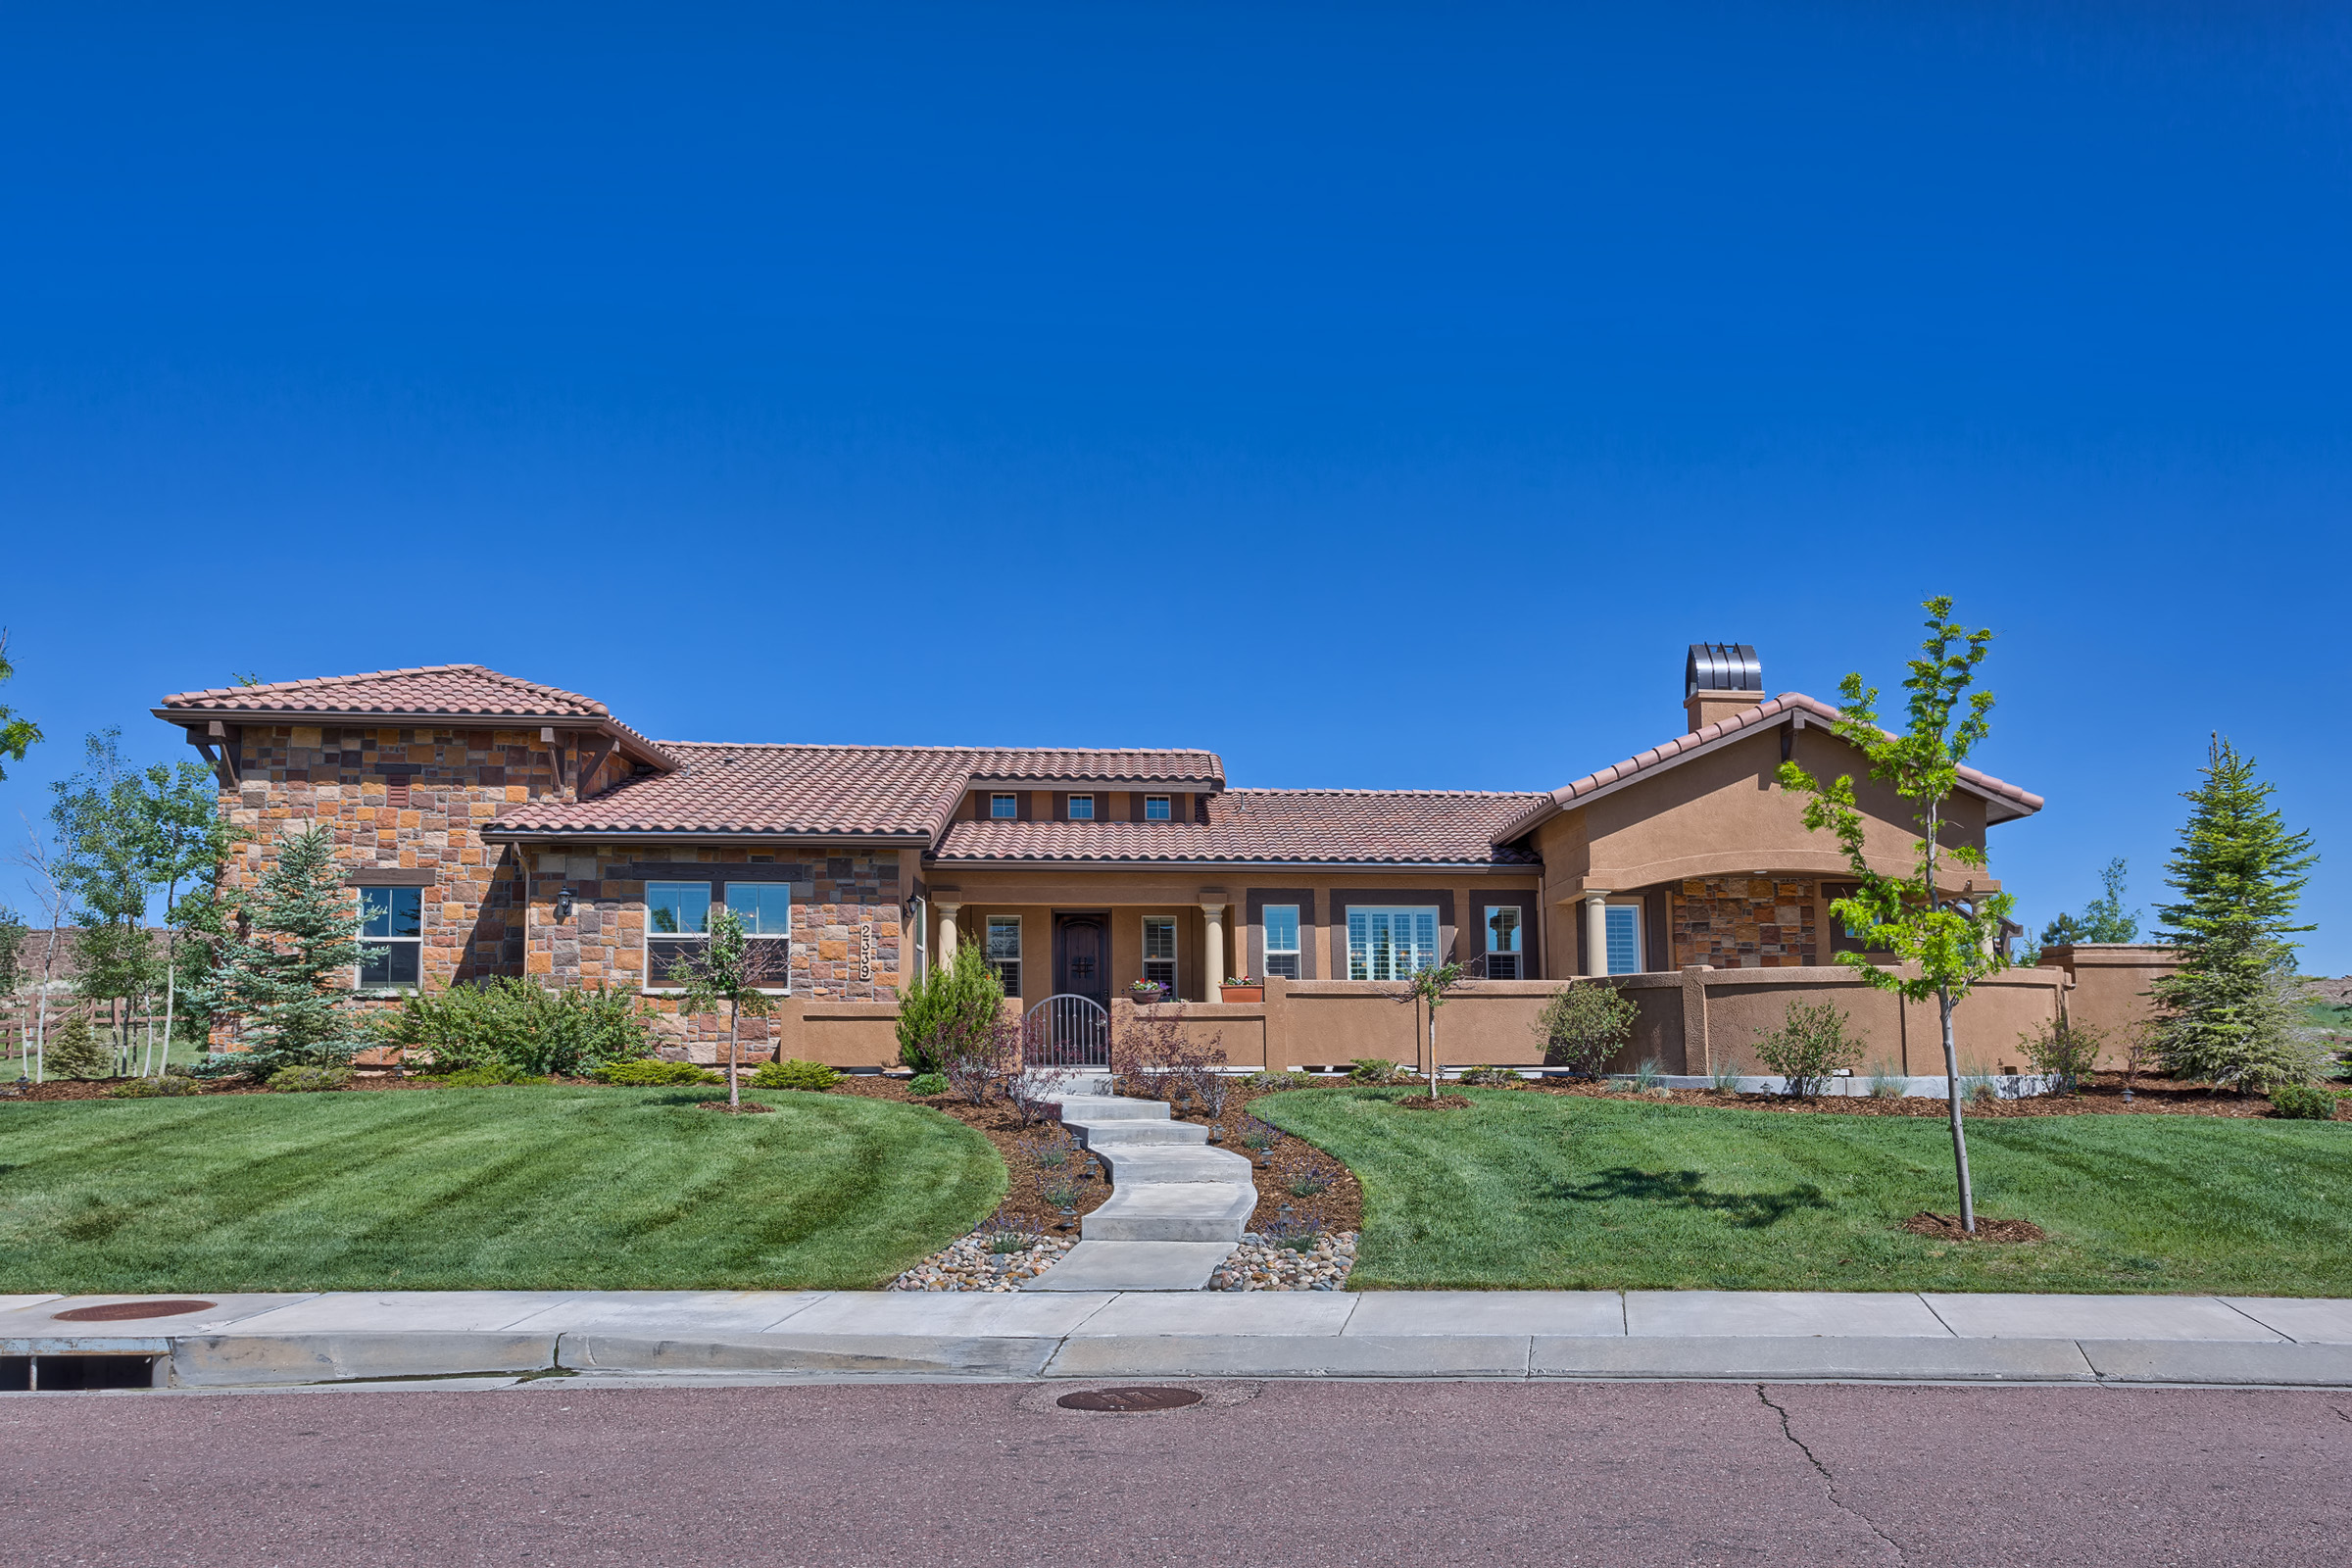
Central Colorado Springs includes the downtown business district, Colorado College, as well as neighborhood housing. Homes in this area include single family, condo’s, lofts, and town homes. Many of these homes are from the early 1900’s and they maintain their charm of early century Victorian style homes, as well as many ranch style homes. Homes in central Colorado Springs are very close to the entertainment, dinning, and shopping opportunities that downtown Colorado Springs offers. The prestigious Old North End is a desirable neighborhood that includes gorgeous older Victorian style homes and is only a short distance from downtown Colorado Springs and I-25.
Central Area Home Search and Market Information
Zip Codes- 80903 & 80910
School Districts- School District 11
Ave Home Price – Approx. $250,000
Home Price Range – Approx. $110,000-$1.2 Million
Major Neighborhoods - Old North End, Patty Jewett, Knob Hill, Divine Redeemer, Spring Creek, Hill Side
For more detailed Central area information you may find some useful information with our neighborhood community information tool. This is a great resource offering community characteristics, maps, aerial & "birds eye" views, nearby schools and school information and nearby attractions and amenities.
Central Real Estate Market Trends
All real estate is local, and conditions for the Colorado Springs real estate market can change dramatically between individual areas, neighborhoods, and price points. Understanding the market dynamics involved in the broader real estate market, the individuals areas, the specific Colorado Springs neighborhood and specific home price point becomes critical when you end up putting an offer in on your next Colorado Springs home.
Total Sales
The chart to the right shows the total number of home sales for the entire Central area year over year. This helps give a very basic feel for home sale activity trends in the broader Central area.
Average Sales Price
The chart to the right shows the year over year average sales price for homes in the broader Central area. This shows the basic trend of home values for the entire Central area.
Average Days on Market before Selling
The chart to the right shows the average days a home was on the market before it went under contract. When for sale home inventory levels are high we are in a buyers market and the average days on market will be higher with downward pressure on prices. With lower inventory levels the ave days on market will be lower, a sellers market, with upward pressure on home prices.




Historically, the choice between renting or buying a home has been a tough decision.
Looking at the percentage of income needed to rent a median-priced home today (28.8%) vs. the percentage needed to buy a median-priced home (17.1%), the choice becomes obvious.
Every market is different. Before you renew your lease again, find out if you can put your housing costs to work by buying this year!