
Powers Real Estate and Area Information
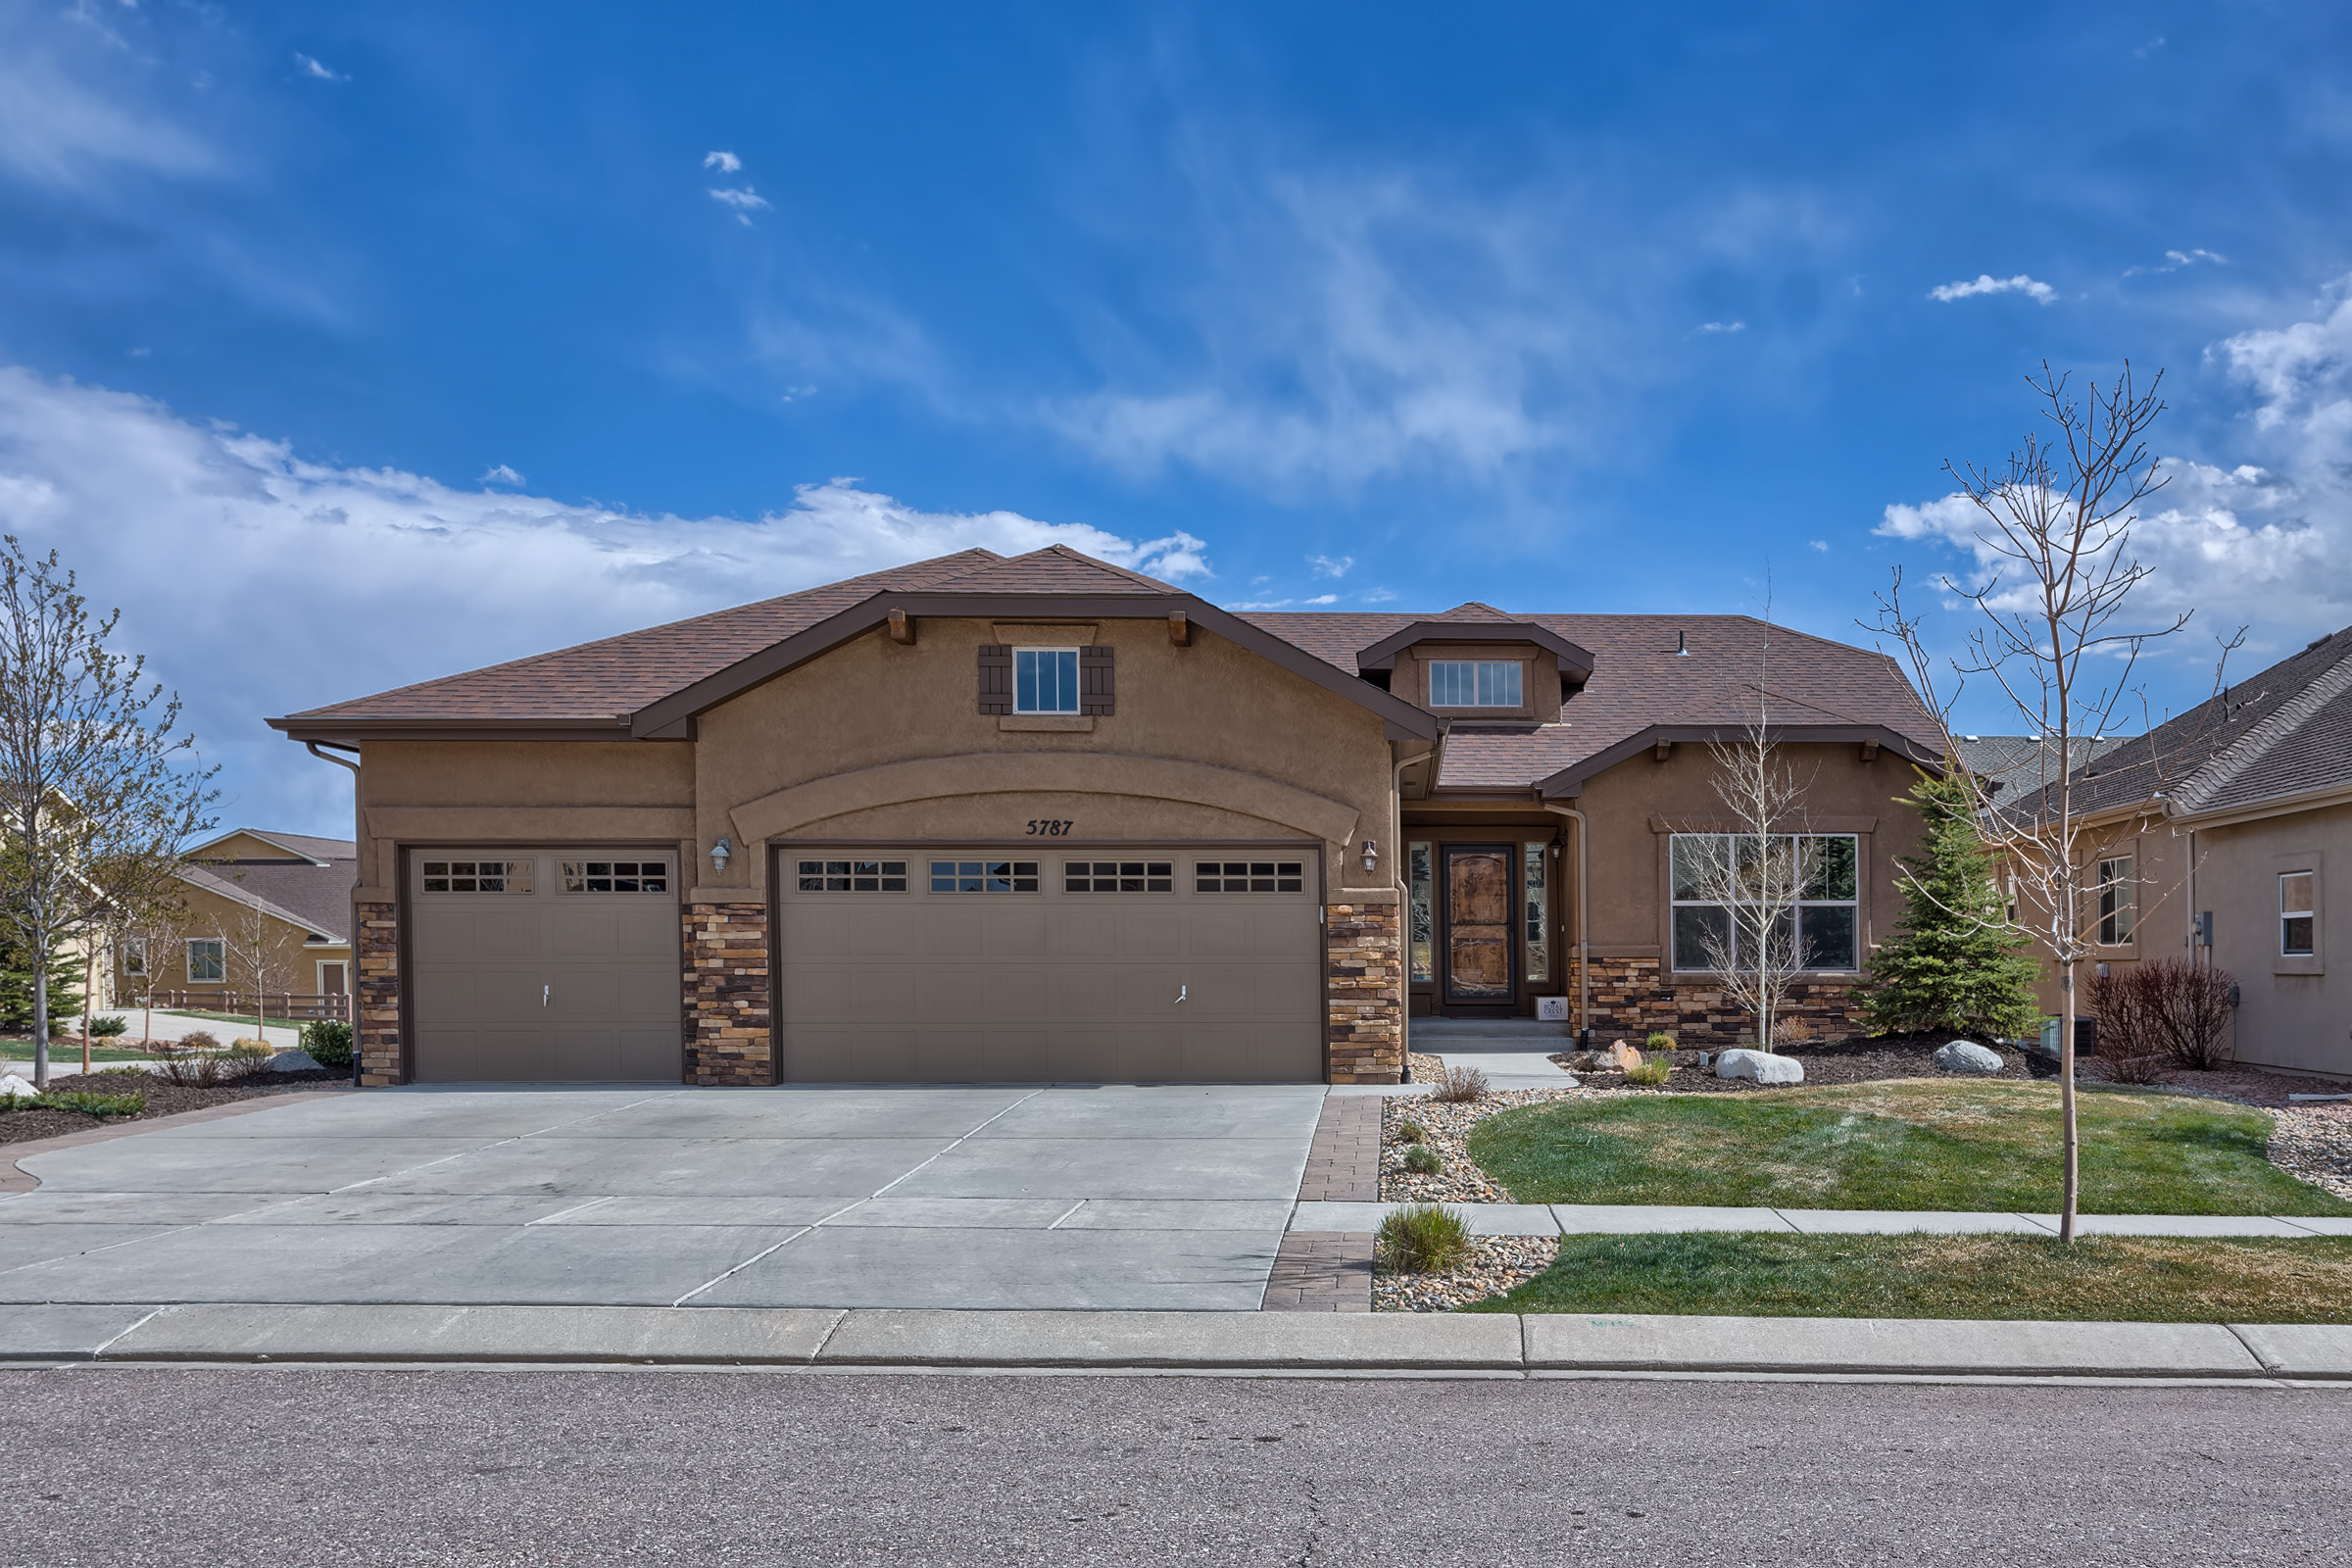
Located in the eastern section of town, powers is easily the fastest growing area in Colorado Springs. The powers area includes affordable housing with close access to Peterson AFB and Shriever AFB, and a 20 minute drive to Ft Carson and is one of the favorite areas among local military homeowners. The powers area is also close to an abundance of new shopping centers, new restaurants, and entertainment. There are many new development neighborhoods giving home purchasers a choice between buying a new construction home or a resale home.
Powers Area Home Search and Market Information
Major Zip Codes- 80922, 80923, 80915, 80914, 80916
School Districts- Falcon District #49, Colorado Springs School District #11
Ave Home Price – Approx. $276,000
Home Price Range – Approx. $80,000-$430,000
Major Neighborhoods - Stetson Hills, Indigo Ranch, Ridgeview, Springs Ranch, Cimmeron Hills
For more detailed Powers area information and statistics to include schools, demographics, and crime click on Community Reports and input Colorado and the zip code - 80922, 80923, 80914, 80915, & 80916
Powers Area Real Estate Market Trends
All real estate is local, and conditions for the Colorado Springs real estate market can change dramatically between individual areas, neighborhoods, and price points. Understanding the market dynamics involved in the broader real estate market, the individuals areas, the specific Colorado Springs neighborhood and specific home price point becomes critical when you end up putting an offer in on your next Colorado Springs home.
Total Sales
The chart to the right shows the total number of home sales for the entire Powers area year over year. This helps give a very basic feel for home sale activity trends in the broader Powers area.

Total Powers aREA home Sales Year over year
Average Sales Price
The chart to the right shows the year over year average sales price for homes in the broader Powers area. This shows the basic trend of home values for the entire Powers area.

Average Home Sales Price for powers Area
Average Days on Market before Selling
The chart to the right shows the average days a home was on the market before it went under contract. When for sale home inventory levels are high we are in a buyers market and the average days on market will be higher with downward pressure on prices. With lower inventory levels the ave days on market will be lower, a sellers market, with upward pressure on home prices.

Average days on the Market before going under contract
Neighborhoods in the Powers Area
Laura's Powers Area Blogs


Historically, the choice between renting or buying a home has been a tough decision.
Looking at the percentage of income needed to rent a median-priced home today (28.8%) vs. the percentage needed to buy a median-priced home (17.1%), the choice becomes obvious.
Every market is different. Before you renew your lease again, find out if you can put your housing costs to work by buying this year!